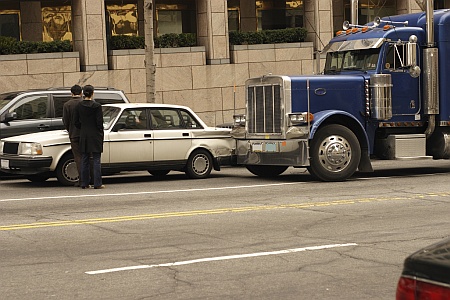
Cost of vehicle crashes a staggering $277 billion per year
A report recently released by the National Highway Traffic Safety Administration (NHTSA) found that motor vehicle crashes cost the U.S. economy a staggering $277 billion in one calendar year.
When combined with societal impacts (loss of life, decreased quality of life due to injuries) the price tag for crashes jumps to $871 billion, according to NHTSA’s study, “The Economic and Societal Impact of Motor Vehicle Crashes, 2010.”
NHTSA’s study includes various factors in calculating price tags, including property damage, medical/rehabilitation costs, congestion costs, legal fees, emergency services, insurance costs, productivity losses, employer costs, etc. NHTSA says about 75 percent of all costs are paid through taxes, insurance premiums, and things like travel delays, all of which are experienced by the general public and not just crash victims.
Vehicle crashes killed almost 33,000 people and injured 3.9 million people while damaging 24 million vehicles.
The report found that in 2010:
- Drunk drivers accounted for 18 percent of the total economic loss due to crashes and cost the nation $49 billion (or $158 for every person in the country). When factoring in lost quality of life, these accidents accounted for $199 billion, or 23 percent of the overall societal harm caused by crashes.
- Speeding vehicles accounted for 21 percent of economic loss and cost the nation $59 billion, or $191 per person. Including lost quality of life, speed-related crashes accounted for $210 billion, or 24 percent of the overall societal harm.
- Distracted driving accounted for 17 percent of the economic loss and cost the nation $46 billion, $148 per individual living in the U.S. Including lost quality of life, these crashes cost $129 billion, or 15 percent of overall societal harm caused by crashes.
- Pedestrian and bike-related crashes accounted for 7 percent of the total economic loss and cost $19 billion. With lost quality of life, these crashes were responsible for $90 billion or 10 percent of societal harm.
- Seatbelt usage prevented $69 billion in medical care, lost productivity, and other injury-related costs. On the other side of things, not using a seat belt resulted in 5 percent of economic loss and cost the nation $14 billion. When factoring in lost quality of life, those numbers change to 8 percent and $72 billion.
“We want Americans to live long and productive lives, but vehicle crashes all too often make that impossible,” said NHTSA Acting Administrator David Friedman. “This new report underscores the importance of our safety mission and why our efforts and those of our partners to tackle these important behavioral issues and make vehicles safer are essential to our quality of life and our economy.”
NHTSA has also been tracking the effects of seat belt use since 1975 and estimates that between 1975 and 2010, seat belts saved over 280,000 lives and prevented 7.2 million injuries, preventing a loss of $1.6 trillion in economic costs alone.
In 2010 alone, more than 3,350 people were killed and 54,300 were seriously injured unnecessarily because they failed to wear their seat belts.
“Seat belt non-use represents an enormous lost opportunity for injury prevention,” the report said.
“While the economic and societal costs of crashes are staggering, today’s report clearly demonstrates that investments in safety are worth every penny used to reduce frequency and severity of these tragic events,” said Transportation Secretary Anthony Foxx.
FMCSA’s Anne Ferro said safety belt usage among bus and medium-to-heavy duty truck drivers is up six percent from 78 percent in 2010 to a new high of 84 percent in 2013.
“It’s a fact that when drivers and passengers buckle-up, their odds increase dramatically for surviving a crash,” said Ferro. “The results of our 2013 survey show that in just the last three years more commercial drivers are getting the message, and we will continue working through programs like the art contest to encourage the remaining 16 percent to buckle-up.”
Other findings from the 2013 Seat Belt Usage by Commercial Motor Vehicle Drivers Survey include the following:
- Safety belt use was higher in states governed by primary belt use laws (85%) than secondary belt use laws (78%)
- The usage rate for drivers and other occupants in the West was 91% compared to the Northeast at 76%
- Commercial bus drivers showed a marked increase in safety belt usage, from 47% to 74%. Dump truck drivers, with the lowest usage rate among trucks, rose from 65% to 70%
- Usage rates were higher on expressways (86%) compared to surface streets (78%)
- Safety belt usage in heavy traffic (85%) continues to be higher than in light traffic (71%)