Americans are back on the road in droves
Estimates released by the USDOT’s Federal Highway Administration (FHWA) show that Americans have returned to pre-Recession habits, logging more than 1.54 trillion miles in the first half of the year, eclipsing a previous high mark of 1.5 trillion in 2007.
The new data, published in FHWA’s latest “Traffic Volume Trends” report, a monthly estimate of U.S. road travel, show that 275.13 billion miles were driven last June, the most ever in June of any year and the highest VMT for the first half of any year – reaffirming calls for increased investment in transportation infrastructure as demand on the nation’s highway system grows.
According to FHWA’s Traffic Volume Trends report, the nation’s driving has increased for 16 months in a row.
At 63.1 billion VMT, traffic in the North Central – 12 states including North Dakota, Ohio and Missouri – was the nation’s most-traveled region for the month representing the seventh consecutive month of VMT growth. The Northeast, a region of nine states stretching from Pennsylvania to Maine, showed the smallest growth – rising only 1.1 percent, or 38.8 billion VMT, compared to the same month a year earlier.
At 10.8 percent, Hawaii led the nation with the largest single-state traffic percent increase compared to the same month a year earlier, followed by Colorado at 7.8 percent and Montana at 7.5 percent.
The new figures confirm the trends identified in “Beyond Traffic,” a USDOT report issued earlier this year, which projects a 43 percent increase in commercial truck shipments and population growth of 70 million by 2045. The report examines the trends and choices facing America’s transportation infrastructure over the next three decades, including a rapidly growing population, increasing freight volume, demographic shifts in rural and urban areas, and a transportation system that is facing more frequent extreme weather events. Increased gridlock nationwide can be expected unless changes are made in the near-term.
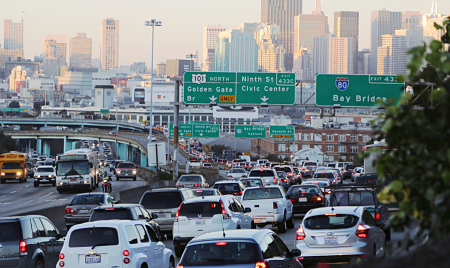
With increased miles traveled, congestion has also returned with a vengeance.
Congestion on U.S. roadways has surpassed pre-recession levels and is now setting new gridlock records, INRIX and the Texas A&M Transportation Institute report in their 2015 Urban Mobility Scorecard.
This INRIX-TTI report comes as Congress is part of the way toward passing a major surface transportation investment measure. The Senate approved its version last month and looks for a House version to emerge soon after lawmakers return from a long summer recess.
The Scorecard authors said the latest data has put to rest any arguments that U.S. driving behavior fundamentally changed in the wake of the 2008-09 recession, to favor less use of motor vehicles. Instead, they said the traditional link between economic growth and roadway congestion has clearly re-emerged.
“The national economy has improved … and unfortunately congestion has gotten worse. This has been the case in the past, and it appears that the economy-congestion linkage is as dependable as gravity,” they wrote. “Some analysts had touted the decline in driving per capita and dip in congestion levels as a sign that traffic congestion would, in essence, fix itself. That is not happening.”
Meanwhile, “the other seemingly dependable trend – not enough of any solution being deployed – also appears to be holding in most growing regions.”
The Mobility Scorecard said that as the economy continued to grow from 2013 to 2014, 95 of the nation’s 100-largest metropolitan areas saw increased traffic congestion, up from just 61 that saw congestion worsen from 2012 to 2013.
Last year, it said, travel delays due to traffic congestion caused drivers to waste more than 3 billion gallons of fuel and kept travelers stuck in cars for nearly 7 billion extra hours, or 42 hours extra hours per rush-hour commuter.
It said the extra annual cost of that gridlock is $160 billion nationwide or $960 per commuter.
The worst-congested areas in 2014, predictably, were in several major metro centers, but the report said the trend is worsening throughout the country and in smaller cities as well as larger ones.
“Washington, D.C. tops the list of gridlock-plagued cities, with 82 hours of delay per commuter, followed by Los Angeles (80 hours), San Francisco (78 hours), New York (74 hours) and San Jose (67 hours),” the groups said.
However, “cities of all sizes are experiencing the challenges seen before the start of the recession – increased traffic congestion resulting from growing urban populations and lower fuel prices are outpacing the nation’s ability to build infrastructure.”